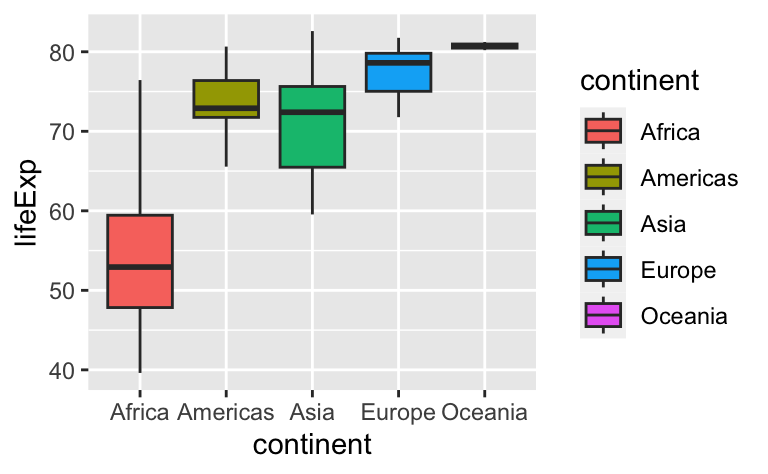
- Learners can apply ten functions from the dplyr R Package to generate a subset of data for use in a table or plot.
Data transformation with dplyr
Research Beyond the Lab: Open Science and Research Methods for a Global Engineer
2024-03-07
A grammar of data wrangling…
… based on the concepts of functions as verbs that manipulate data frames
select: pick columns by namearrange: reorder rowsfilter: pick rows matching criteriarelocate: changes the order of the columnsmutate: add new variablessummarise: reduce variables to valuesgroup_by: for grouped operations- … (many more)
Plot
Take a break
Please get up and move! Let your emails rest in peace.

10:00
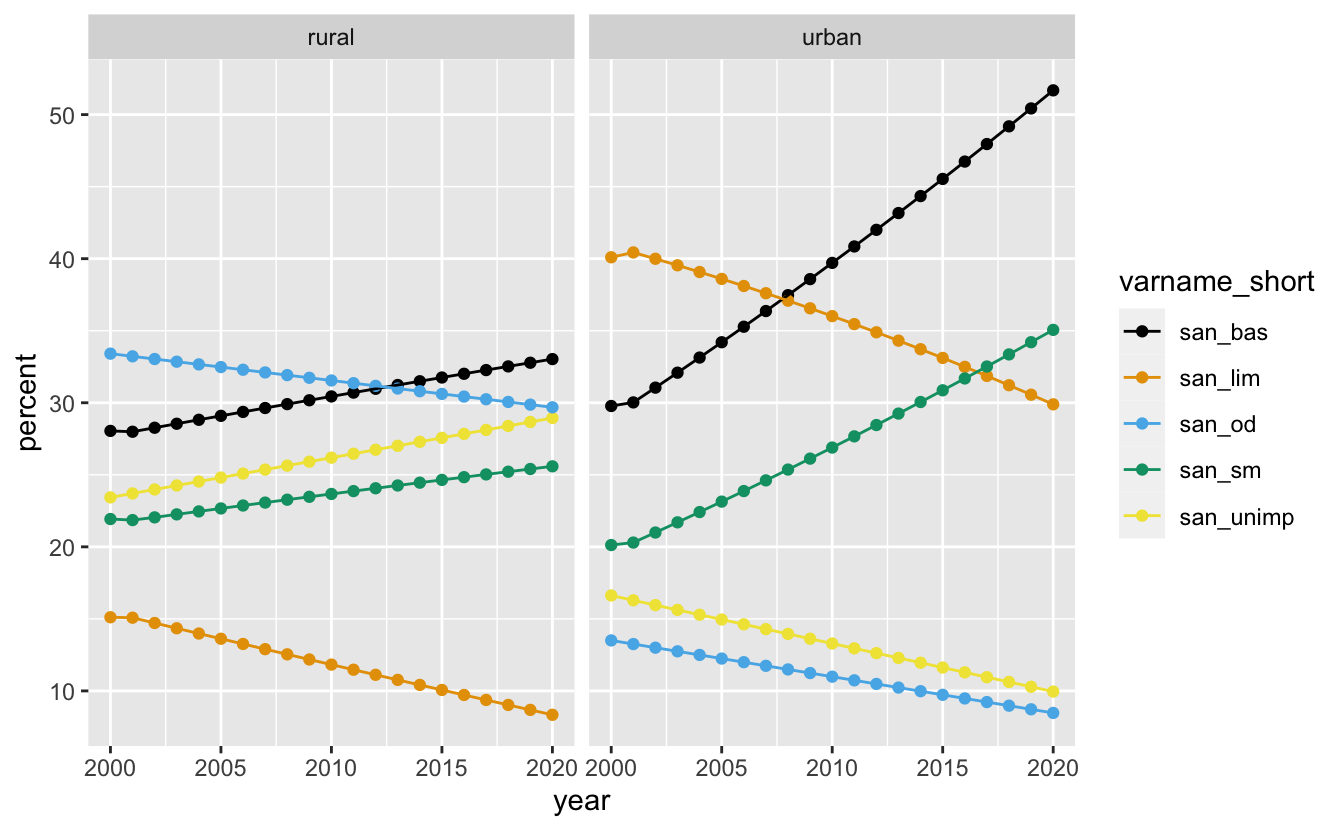
Task 1.3 - Connected scatterplot
Take a break
Please get up and move! Let your emails rest in peace.
15:00