Data for your capstone project
In module 4, you designed a waste management survey. Part of this homework is to collect data for your survey from at least 5 people. You will then import the data and prepare one data visualization and one table to explore it and document your work.
Step 1: Collect data for your survey
- The following spreadsheet contains a list of assigned GitHub usernames to five people that were randomly assigned to answer your survey: https://docs.google.com/spreadsheets/d/165-x1_FLE8hjgFZYuNEMSiyprwabmvFw4CLKK8xddB4/edit#gid=0
- Open an issue on your GitHub repository and ask these five people to answer your survey by tagging their username with the
@symbol in the issue description. - You yourself will be tagged in five GitHub issues of other people. After completing the survey, provide a comment on the issue with two bullet points with suggestions for improvements of the survey you have completed. Tag the course instructor
@larnscein your comment.
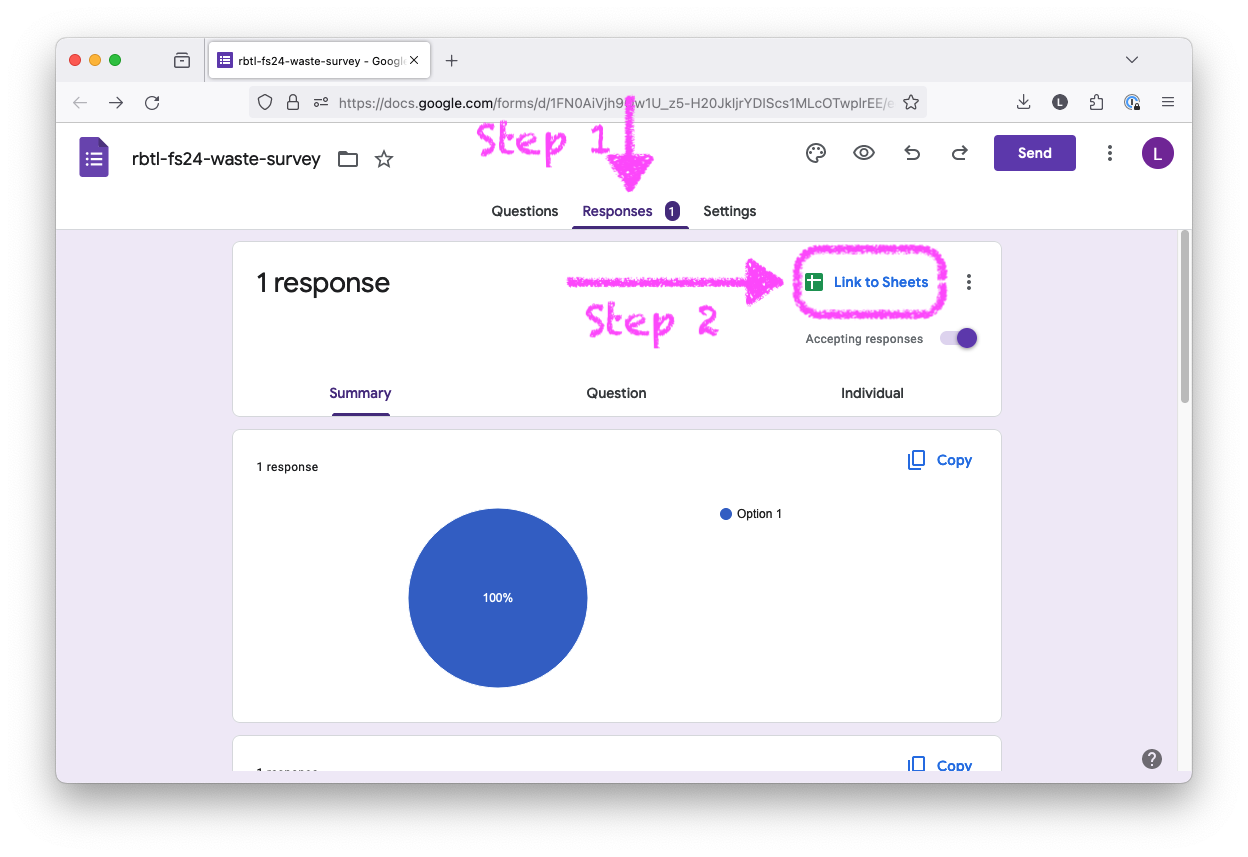
Step 2: Create Google Sheet
Once you received one response to your survey, you need to create a Google Sheet from the responses. See the following screenshot for how to do that.
The spreadsheet will open as a new tab in your browser and you can then copy the URL from the address bar for Step 3.
Warning: Do not edit the unprocessed raw data manually!
The goal is to keep the raw data untouched and use R to prepare the processed, analysis-ready data.
Step 3: Import your unprocessed raw data and tidy it up
- Clone the survey-USERNAME repository you created in module 4 to Posit Cloud.
- Open your survey-USERNAME repository on Posit Cloud.
- Create a new
.Rfile and save it asdata_cleaning.Rin the folder. - Use the skills you have learned in assignment 3 of module 3 to import your data using the
googlsheets4R package: https://rbtl-fs24.github.io/website/assignments/md-03/am-03-3-spreadsheet.html#step-4-google-authentication-and-data-import - Write R code to prepare a processed analysis-ready data set (e.g. rename columns, fix dates, coerce data types, etc.) and save it as a
.csvand.rdsfile in a newly createddata/processedfolder in your repository.
Step 4: Create a new Quarto document
- Open your survey-USERNAME repository on Posit Cloud.
- Navigate to the Files tab in the bottom right window of RStudio, and create a new folder called
docs. - Create a new Quarto document and save it as
index.qmdin thedocsfolder.
Step 5: Import .rds file
- Open the
index.qmdfile from Step 3 and import your data in.rdsformat by using the suggestedhere::here()function below:
library(readr)

survey <- read_rds(here::here("data/processed/your-file-name.rds"))
File paths & project-oriented workflows. The very short version: use
here::here()!
The short version
When you use RStudio projects (we do & I highly recomment it), the working directory will be set to the root of the project folder.
When you are working in a Quarto document (.qmd), the beginning of your file path will be the location of your Quarto document.
If your Quarto document sits in the root directory, you can access any file using relative file paths.
However, when your Quarto document is in a subdirectory (e.g., docs), you cannot easily access files in the root directory using relative file paths.
That is why it is best practice to use the here::here() function to create file paths in Quarto documents. The here::here() function is a best practice for creating file paths in R scripts and Quarto documents. It is beneficial when working with RStudio Projects because it allows you to write file paths relative to your RStudio Project’s root directory.
The details
That’s the short version, the extended version needs a more detailed explanation of how file paths work in .R scripts, Quarto documents and RStudio Projects (.Rproj). If you are interested in learning more, then refer to the following resources:
Step 6: Create a data visualization and a table to explore your data
- Use the
ggplot2R package to create a data visualization from your survey data. - Use the
kablefunction from theknitrR package to create a table from your survey data. - Use the
@symbol in your text to cross-reference your table in your Quarto document (tipp: review the class exercises from module 5). - (stretch goal): Use the
@symbol in your text to cross-reference your data visualization in your Quarto document.
Step 7: Submit homework assignment
- Add all files to the commit, commit the changes with a meaningful commit message, and push the changes to GitHub.
- Open an issue on GitHub on your survey-USERNAME repo and tag the course instructor
@larnsce.