- Learners can extract the, (a) Research Question, (b) Sampling strategy, and (c) Key findings from a scientific paper about waste management.
- Learners can produce a data-collection tool that could be used to collect the data presented in a scientific paper about waste management.
- Learners can critique and revise their peers data-collection tools, despite not having an in-depth understanding of the topic.
- Learners can identify quality criteria for their own data collection tool.
Prepare presentation
Waste Research - Overview
Next week we will host 3 visiting professors (Prof. Katharina Gapp, HEST, Prof. Christoph Studer, ITET, Prof. Verena Zimmerman) and Dr. Sarah Shephard, who is the Course leader of ‘Teaching at ETH’, which is a course that I am enrolled in. You can read more here. The class will be filmed, but will only be available among the four of us.
Sometimes we read papers to learn about results: what are the new findings in a discipline. Sometimes, we read papers to learn about methods. In this case, we are interested in learning about different styles of data collection and data collection tools. For example: did the researcher collect information on the same variable multiple times to see how it changes across seasons? Did the researcher collect information from people to see how the outcome of an intervention differs between populations? Before we develop our own data collection tools and spreadsheets, we will see what kinds of data other waste researchers collect, and try to imagine how they structured their data collection and management tools.
Learning Objectives
Homework
The papers we will study are available to download here and can also be found in the Readings section of Module 08.
Each group has been assigned a paper to read. The paper allocation list can be found here: https://docs.google.com/spreadsheets/d/1k4qA_FOtZBGn1RL4pzfvTq-hb9-pXnH58oyY0n1nAog/edit#gid=0
Four people have been assigned to each paper and each group will be responsible for the following tasks:
- Your group will have 5 minutes to give a 3-slide overview of the
- Research Question
- Sampling strategy (who or what did they sample, measure)
- Key findings (focus on 1 key figure or outcome that best answers the research question)
Followed by 2 minutes for any clarifying questions from the audience. Complete comprehension is not required, but the whole class should be have a general understanding of what the paper was about
- Your group will then share the “data table” that you have created. Your data table/spreadsheet will be your attempt to “reverse engineer” the data structure that was used to generate the results of the paper. Ask yourself: “in order to use the data that was collected, what is the best way to structure it before analysis”. Before class you will create a shared google sheet with:
- Tab 1: The codebook that would have been generated for this research (i.e. present the variables and their units, clearly explained)
- Tab 2: A sample spreadsheet of how the data would look in its raw, unprocessed form (i.e. an empty spreadsheet with rows and columns clearly labelled), taking into account the research design (i.e. was the data collected multiple times over a period of time; was data collected from multiple sources and compared, etc.)
- Tab 3, 4, 5: a copy of the sample spreadsheet/data frame for each of the other groups to work on during the collaborative session (more on that below)
For example: If we have this figure on the age gap between men and women:
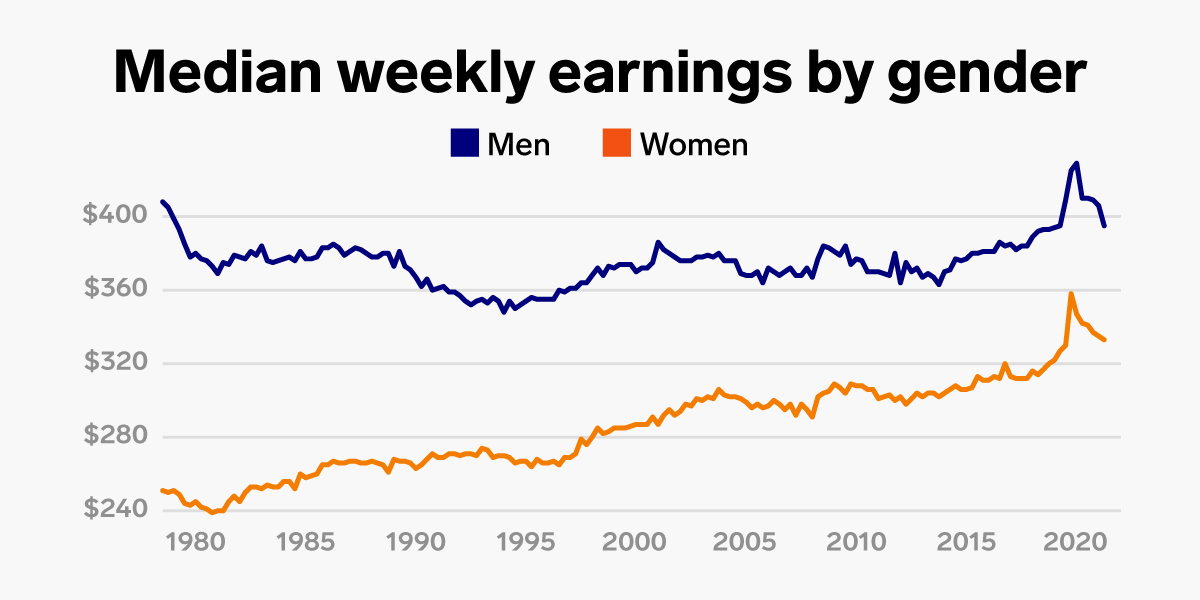
Our data table would look like this:
| year | gender | income |
|---|---|---|
| 1980 | male | 400 |
| 1980 | female | 240 |
| … | … | |
| 2020 | male | 450 |
| 2020 | female | 360 |
*It is not necessary to fill in the values: just construct the dataframe
- The class will then have 5 minutes to work on their own copy of the dataframe (on their own tab).Specifically, each group (that did not read the paper) will
- Add variables that have been omitted
- Make changes to the table structure
- Revise the coding, codebook, units, etc.
- While the other groups are working on the edits, the presenting group will click through the different tabs and “harvest” the ideas that make sense and revise their own, original table.
- The presenting group will then have 5 minutes to summarise to the class what changes they made and why. We will collect all of the feedback on each round of revisions (i.e. all 4 papers) so that at the end of class we can consolidate the ideas and try to explain: what makes a good data structure?
The schedule is presented below.
Presentation schedule - Module 09 - Waste Research
| start | end | Topic | Activity |
| 12:15 | 12:20 | Intro and Welcome | |
| 12:20 | 12:27 | waste pickers | summary |
| 12:27 | 12:33 | waste pickers | data table revisions |
| 12:33 | 12:42 | waste pickers | discussion |
| 12:45 | 12:52 | WTP waste | summary |
| 12:52 | 12:57 | WTP waste | data table revisions |
| 12:57 | 13:02 | WTP waste | discussion |
| break | |||
| 13:15 | 13:27 | Air quality | summary |
| 13:27 | 13:32 | Air quality | data table revisions |
| 13:32 | 13:37 | Air quality | discussion |
| 13:40 | 13:47 | compost | summary |
| 13:47 | 13:52 | compost | data table revisions |
| 13:52 | 13:57 | compost | discussion |
| break | |||
| 14:15 | 15:00 | Consolidation |
By the end of the first 2 hours, you will have worked on the data tables from four different papers and will have gained a lot of insights into what works and what doesn’t. At the end of the class we aggregate what we learned from these exercises so that we can transfer these insights into our own projects and be able to identify the factors that make a data set good.
We will structure the consolidation section of the class by trying to identify what makes a good data structure for analysis so that we can compile a list of quality assessment criteria. We will compile the feedback according to the following themes:
- Patterns: what were good and/or bad things that you noticed repeating. What were the consistent mistakes and in turn, the consistently successful factors?
- Gaps: what did we forget? What was often missing? And how did we fix these challenges?
- Logic: Where did we get stuck on the interpretation from the end result to the data? What logical errors did we make and how can we avoid them going forward?
- Priorities: We couldn’t do everything (all variables, all figures) and will never be able to. When thinking about your own data, what priorities should we consider; what factors can we let slide?
By the end, we will have a comprehensive overview of what a good data structure looks like that we can apply to our own projects!